Introduction to Data Science
Master the PyPlot and NumPy libraries and become a Python data scientist!
This course includes.
Curriculum & lectures.
+ Welcome! 2 lectures Preview
About this course.
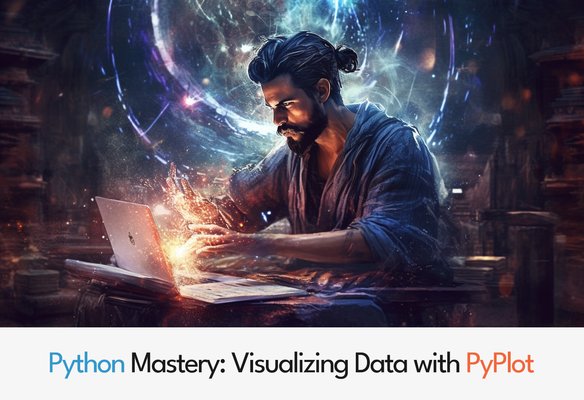
Course 1: Matplotlib for Data Plotting in Python
This course is designed to guide you through the process of
installing Matplotlib and leveraging its capabilities for data plotting
in Python. With a focus on the PyPlot function, which plays a crucial
role within the library, you will learn how to create visually appealing
2D plots. From basic line plots to advanced visualizations for multiple
datasets, this course covers a wide range of plotting techniques.
Course Highlights
- Learn how to install and set up Matplotlib for data plotting in Python.
- Explore the fundamental concepts of PyPlot function and its role in creating 2D plots.
- Start with simple line plots and progress to complex visualizations for multiple datasets.
- Discover how to personalize graphs by customizing colors, labels, and other visual elements.
- Master the creation of various types of plots, including histograms, bar charts, pie charts, and 3D plots.
Course Benefits
- Gain valuable skills in data science and visualization, regardless of your experience level.
- Access all source code at no additional cost to facilitate your learning journey.
- Improve your ability to present data effectively and make insightful visualizations.
- Enhance your understanding of data representation and communication through plots.
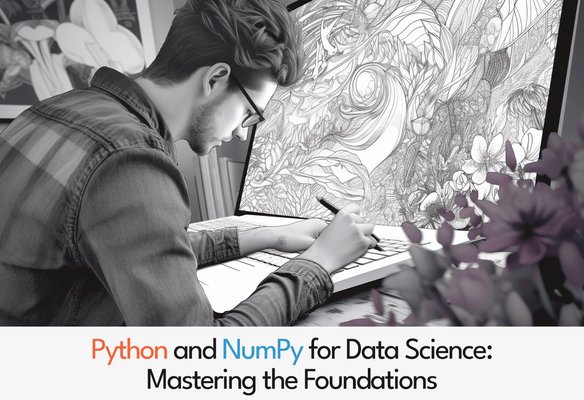
Course 2: Mastering NumPy for Arrays and Matrices
This course offers a comprehensive exploration of the NumPy
library, the go-to tool for handling arrays and matrices in data science
and machine learning. By enrolling in this course, you will learn how
to construct NumPy collections and leverage its powerful functions for
efficient data manipulation and analysis.
Course Highlights
- Understand the fundamentals of arrays and matrices and their significance in data science.
- Learn how to construct and manipulate NumPy collections, including arrays and matrices.
- Explore the wide range of functions available in NumPy for efficient data manipulation.
- Discover advanced techniques and strategies for working with NumPy in data science projects.
Course Benefits
- Access all source code and presentations to facilitate your learning process.
- Gain a deeper understanding of the NumPy library and its applications in data science.
- Improve your data science skills and enhance your ability to work with numerical data.
- Excel in your field by mastering the essential tool for arrays and matrices.
Embark on these remarkable courses and elevate your data science
and visualization skills with Matplotlib and NumPy. Whether you are a
beginner or an experienced practitioner, these courses are designed to
empower you with the knowledge and techniques needed to excel in your
field.
Taught by people who ship.
Team Mammoth
Produced by a team of Mammoth Club industry experts. Over 14 years, Mammoth Club has built a global student community in 190+ countries with 9+ million courses sold, releasing over 1,000+ courses and 5,000+ hours of video content.
Ready to start building?
Master the PyPlot and NumPy libraries and become a Python data scientist!